
MarketWise Reports Q2 Billings Increase of 57% YoY to $91.2 Million and Q2 CFFO Increase of 25.7% to $22.4 million; Net Revenue of $75.8 Million and Net Loss of $2.6 Million for Second Quarter 2026; Raises FY 2026 Billings Guidance 10% to $330 million; Affirms FY 2026 Dividend Target To Class A Shareholders of $1.80 Per Share
BALTIMORE, Aug. 06, 2026 (GLOBE NEWSWIRE) -- MarketWise, Inc. (NASDAQ: MKTW) (“MarketWise” or the “Company”), a leading multi-brand digital subscription services platform that provides premium financial research, software, education, and tools for self-directed investors, today reported financial results for second quarter 2026.(1)
Second Quarter 2026 Highlights(1)
- Billings for second quarter 2026 totaled $91.2 million, representing a 57% year-over-year increase compared to second quarter 2025, and the highest quarterly Billings since 2023.
- Cash from Operating Activities (“CFFO”) was $22.4 million in the second quarter 2026, an increase of $4.6 million or 25.7% compared to the second quarter 2025, primarily driven by higher Billings and movements in working capital.
- Total Net Revenue was $75.8 million in the second quarter 2026(2)
- Net Loss was $2.6 million in the second quarter 2026 due primarily to the difference in the timing of deferred revenue recognition and the increase in sales and marketing costs.
- Cash and cash equivalents remained strong at $33 million as of June 30, 2026, which includes the $12.2 million cash disbursement in April 2026 related to the previously disclosed legal settlement and the associated repurchase of 3% of total shares outstanding.
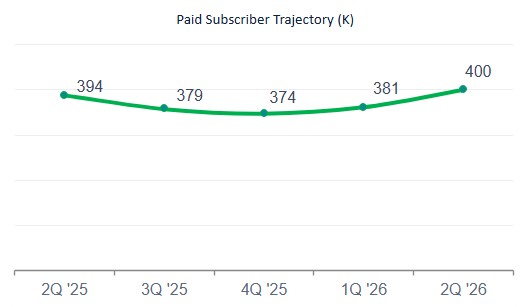
- Paid Subscribers were 400 thousand as of June 30, 2026, compared to 381 thousand as of March 31, 2026. Active Free subscribers were 2.1 million as of June 30, 2026.
- Raised FY 2026 guidance for Billings by 10% to $330.0 million, which represents a 21.7% full year increase compared to FY 2025.
- Dividends paid to Class A Shareholders during the quarter were $0.45 per share. No change to full year dividend target of $1.80 per share.
(1) All quarterly results reported herein are unaudited.
(2) Net Revenue (a GAAP measure) represents Billings that are recognized over the term of the subscription, which can be multiple years. Billings are amounts invoiced to customers in the period and is thus indicative of the current operating environment and demand for our products.
"As we shared in mid-July, the operational momentum from the first quarter continued into the second quarter as Billings topped $91 million on the back of higher customer acquisition, improved customer retention, and strong conversion of our higher priced products” said Dr. David Eifrig, Chief Executive Officer. “Our strategy is simple. Acquire the right customers with compelling products and ideas, earn trust as we educate and empower, and then deepen our relationship with our customers over time.”
Eifrig continued, “As we mentioned previously, for the first quarter, and continuing into the second quarter, we meaningfully increased investment in customer acquisition. This opportunistic marketing investment resulted in a strong increase in Paid Subscribers during the first and second quarters. Consistent with our plans, we now moderate customer acquisition and shift toward disciplined cash generation for the balance of the year. This is the strategic core of our business model, where we toggle between growth and margin, on a near real-time basis, in response to market conditions and opportunity. As such, while margins were lower in the first half of 2026 due to an increase in investment in customer acquisition, we expect margins to increase significantly in the second half of the year.”
“Regarding our financial guidance, given the robust growth in the first half of 2026, we are increasing our FY 2026 Billings Target by 10% to $330 million, which represents a 21.7% increase compared to FY 2025.”
“Finally, as I mentioned last quarter, we recently completed a review of our long-term strategic plan with our Board of Directors. To reiterate some of those points, I am more excited than ever about our plans to provide high-quality products for our customers while delivering strong top-line growth coupled with margin expansion over time. The plan also forges the alignment of incentives as we execute our business strategy. Achieving our ambitious plans will require discipline, innovation, and operational creativity. We have fantastic brands, fantastic teams, and a strategy designed to enhance value for subscribers and shareholders."
Our summary results and selected financial data are as follows:
| (Unaudited, in millions, except per share data or otherwise noted) | 2Q 2025 | 3Q 2025 | 4Q 2025 | 1Q 2026 | 2Q 2026 | TTM 2Q 2026 | |||||||||||||||
| Paid Subscribers (in thousands) | 394 | 379 | 374 | 381 | 400 | N/M | |||||||||||||||
| Total net revenue | $ | 80.0 | $ | 81.3 | $ | 83.4 | $ | 77.0 | $ | 75.8 | $ | 317.5 | |||||||||
| New "Marketing" Billings(1) | $ | 41.6 | $ | 48.7 | $ | 57.5 | $ | 60.9 | $ | 73.6 | $ | 240.7 | |||||||||
| Net "Renewal" Billings(2) | $ | 15.4 | $ | 14.1 | $ | 17.5 | $ | 19.0 | $ | 16.4 | $ | 67.0 | |||||||||
| Other Billings(3) | $ | 1.2 | $ | 0.8 | $ | 3.9 | $ | 1.5 | $ | 1.1 | $ | 7.4 | |||||||||
| Total Billings | $ | 58.2 | $ | 63.7 | $ | 78.9 | $ | 81.4 | $ | 91.2 | $ | 315.1 | |||||||||
| ARPU (in dollars) | $ | 474 | $ | 566 | $ | 670 | $ | 738 | $ | 822 | $ | 2,795 | |||||||||
| Net income | $ | 15.3 | $ | 17.9 | $ | 14.0 | $ | (0.6 | ) | $ | (2.6 | ) | $ | 28.7 | |||||||
| CFFO(4) | $ | 17.8 | $ | 2.2 | $ | 24.2 | $ | (2.1 | ) | $ | 22.4 | $ | 46.7 | ||||||||
| Adjusted CFFO | $ | 17.8 | $ | 2.2 | $ | 24.2 | $ | (2.1 | ) | $ | 22.4 | $ | 46.7 | ||||||||
| Free Cash Flow | $ | 17.5 | $ | 1.7 | $ | 23.7 | $ | (2.7 | ) | $ | 21.4 | $ | 44.1 | ||||||||
| Earnings per share - basic | $ | 0.55 | $ | 0.60 | $ | 0.79 | $ | (0.23 | ) | $ | (0.24 | ) | $ | 0.93 | |||||||
| Earnings per share - diluted | $ | 0.53 | $ | 0.58 | $ | 0.76 | $ | (0.23 | ) | $ | (0.24 | ) | $ | 0.87 | |||||||
| Regular dividends per Class A share(5) (6) | $ | 0.20 | $ | 0.20 | $ | 0.20 | $ | 0.25 | $ | 0.25 | $ | 0.90 | |||||||||
| Special dividends per Class A share(5) (6) | $ | 0.10 | $ | 0.20 | $ | 0.20 | $ | 0.20 | $ | 0.20 | $ | 0.80 | |||||||||
| Total dividends per Class A share(5) (6) | $ | 0.30 | $ | 0.40 | $ | 0.40 | $ | 0.45 | $ | 0.45 | $ | 1.70 | |||||||||
| Class A Shares(7) | 2.4 | 2.5 | 2.4 | 2.5 | 2.7 | 2.5 | |||||||||||||||
| Class B Shares(7) | 13.6 | 13.6 | 13.6 | 13.6 | 13.0 | 13.5 | |||||||||||||||
| Total Shares(7) | 16.0 | 16.1 | 16.1 | 16.1 | 15.7 | 16.0 | |||||||||||||||
| (1) Includes billings from all new subscription sales to new and existing subscribers. | |||||||||||||||||||||
| (2) Includes billings attributable to renewal and maintenance fee payments. Excludes Membership sales. | |||||||||||||||||||||
| (3) Includes primarily billings from Revenue Share, Advertising, and Conferences. | |||||||||||||||||||||
| (4) CFFO will fluctuate from quarter to quarter based on inherent variability in our business (2Q and 4Q tend to be higher; 1Q and 3Q, lower). CFFO can also be impacted by timing of product launches, marketing campaigns and discreet working capital items. | |||||||||||||||||||||
| (5) Dividends prior to April 2, 2025 have been retroactively adjusted to give effect to the 1-for-20 reverse stock split. See dividend guidance in the “Full Year 2026 Targets” section below. | |||||||||||||||||||||
| (6) A portion of the dividends paid to Class A shareholders are a result of our corporate structure, resulting tax distribution payments, and excess tax distributions received by the Company. Historically, we have characterized these dividends that are funded from the excess tax distributions (currently at $0.20) as “special”. However, given the mechanical nature of the excess tax distribution and resulting dividend, along with the expectation that tax distributions will continue, beginning in Q3 2026 these dividends will be recharacterized as “regular” along with the other recurring regular dividend of $0.25, for a total quarterly dividend of $0.45. | |||||||||||||||||||||
| (7) Excludes Management and Sponsor Earnout Shares. Amount in the TTM 2Q 2026 column is the average of the last four quarters | |||||||||||||||||||||
| N/M - Not Meaningful | |||||||||||||||||||||
GAAP Net Revenue versus Billings
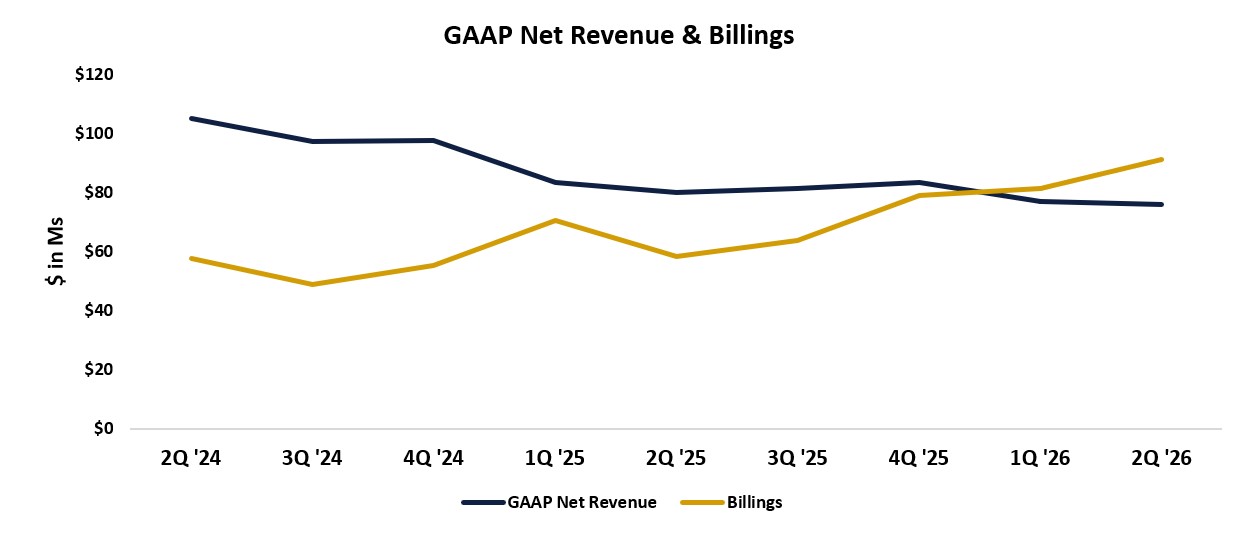
GAAP Net Revenue represents cash received by the Company for the sale of subscriptions which are then recognized as revenue for GAAP purposes over the term of the subscription, or up to 5 years. Cash received by the company is recorded as Deferred Revenue on the Balance Sheet until such amounts are recognized as GAAP Net Revenue. Given the deferred nature of revenue recognition, there can be a significant lag between when cash is received by the Company and when revenue is recognized in the Income Statement. To illustrate, Net Revenue recognized in Q2 2026 included significant cash sales from 2021 and 2022. As such, GAAP Net Revenue may not be indicative of the current trajectory or operating environment of the Company. In contrast, Billings, represent current period cash sales by the Company which is reflective of the current, real-time operating activity of the Company. The disconnect between GAAP Net Revenue and the current trajectory of the Company can be observed in our 2026 results. Specifically, GAAP Net Revenue declined 5.2% from Q2 2025 to Q2 2026 whereas Billings, the actual cash sales of the business, increased 56.7%. We expect a similar dynamic to occur during FY 2026 where GAAP Net Revenue will decline while customer sales activity and Billings increase. Billings tend to lead Net Revenue by 12-24 months, on average, and as such we expect Net Revenue to stabilize in 2026 and return to growth in 2027.
The historical relationship between GAAP Net Revenue and Billings is illustrated in the following chart:
Selected Operational and Financial Supplemental Information
We are providing the additional information below to provide further context on results and trends.
Paid Subscribers
Paid Subscribers at June 30, 2026 were 400 thousand, an increase of 19 thousand or 4.8% from 381 thousand as of March 31, 2026. The increase in Paid Subscribers, as presented in the chart below, is a result of compelling products and content combined with the significant investment in direct marketing in the first half of 2026. Our plan for the second half of 2026 is to scale back marketing investment and focus on monetization of existing subscribers which could result in modest declines in Paid Subscribers as we strategically balance growth and margin.
Subscriber Composition Trends
As of June 30, 2026, the Company had 2.1 million Active Free Subscribers. Part of the Company’s acquisition strategy is to convert Active Free Subscribers to Paid Subscribers. As of June 30, 2026, the Company had 400 thousand Paid Subscribers, which is an increase of 4.8% compared to March 31, 2026.
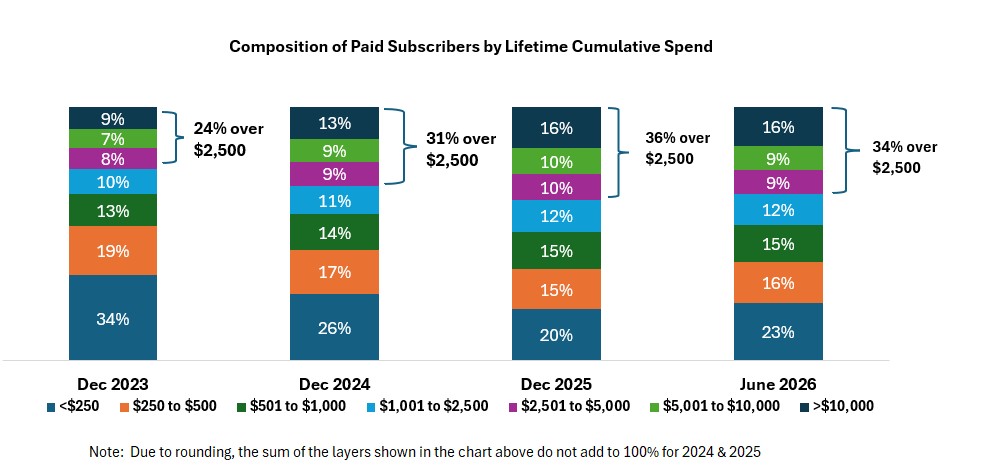
As previously disclosed, the Company’s strategy has pivoted since mid-2024 to focus on higher priced products. Thus, while Paid Subscribers have declined over the last 2 years in absolute terms, with modest sequential improvement in the two most recent quarters, the quality and lifetime spend of the subscribers have increased.
As illustrated in the chart below, the customer mix has improved over time with 61% of customers as of June 30, 2026, having a lifetime spend of more than $500. In contrast, the majority of customer churn is from the lower value tiers as those cohorts generally continue to decline as a percent of the total. As of June 30, 2026, however, the $500 or less cohort increased due to the successful customer acquisition efforts in the quarter. As these new customers purchase additional products, we expect lifetime spend for this cohort to increase.
This positive mix shift and improvement in customer quality has contributed to the Billings and ARPU growth experienced over the last several quarters.
Billings
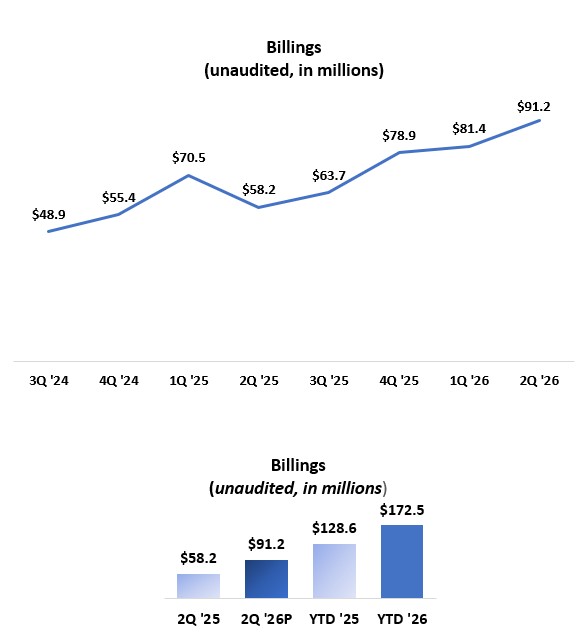
After the period of Billings declines from 2021 through mid-2024, the Company experienced an inflection point in Q4 2024 with a return to sequential Billings growth. Billings have continued a steady increase with an increase in Q2 2026 Billings of 57% year over year and 12% sequentially, to approximately $91.2 million. The increased Billings, which represents the highest total since 2023, was the result of our marketing efforts in the quarter which yielded a significant cohort of new subscribers combined with strong revenue retention from existing subscribers. The chart below illustrates Billings trends over the last several quarters and demonstrates the sustained recovery in Billings since Q3 2024.
Cash Flow from Operating Activities
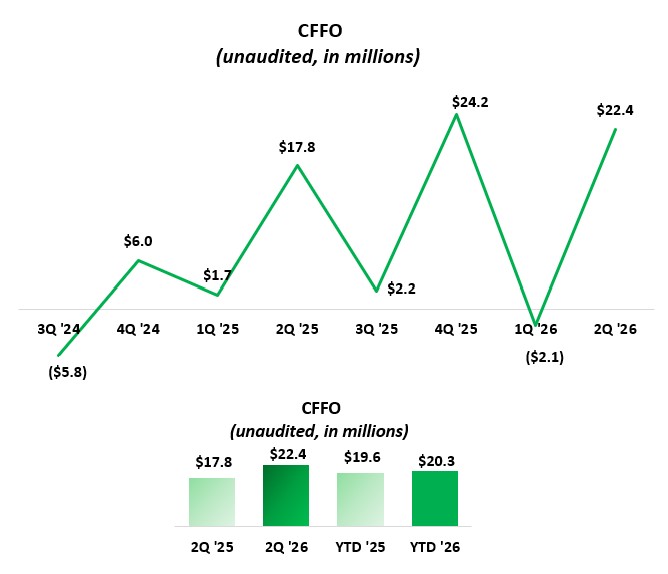
CFFO was $22.4 million for the three months ended June 30, 2026 which was an increase of $4.6 million compared to Q2 2025. For the six months ended June 30, 2026, CFFO was $20.3 million compared to $19.6 million for the same period in FY 2025.
Based on the nature of our business, and as illustrated in the chart below, CFFO fluctuates from quarter to quarter. Specifically, Q2 and Q4 tend to have higher CFFO while Q1 and Q3 tend to have lower CFFO. The amount of CFFO in any given quarter is impacted by the timing of product launches, marketing campaigns, and discrete working capital items.
Given this variability, we believe it is useful to evaluate CFFO trends over multiple quarters, or a full year.
Balance Sheet and Capital Structure
As of June 30, 2026, the Company held cash and cash equivalents of $33 million, down from $53 million at March 31, 2026. The decrease was primarily due to a $12.2 million cash disbursement made in April 2026 in connection to the previously disclosed legal settlement, including termination of related rights under the Company’s Tax Receivable Agreement and resolution of the associated litigation claims. The disbursement also resulted in the buyback of 3% of the Company’s total shares outstanding.
As previously disclosed, we expected FY 2026 tax distributions to decline to approximately $35.0 million, nearly $14.8 million below FY 2025. However, given continued improvement in business performance, full-year 2026 tax distributions are now expected to be approximately $40.0 million. Consistent with the timing of FY 2025 tax distribution payments, FY 2026 distributions will be higher in the first half of the year and lower in the second half. As a result, due to the timing of tax distribution payments and higher expected margins in the second half of the year, we expect overall cash balances to increase during the second half of 2026.
MarketWise Inc.’s Class A common stock trades on the Nasdaq Global Market under the symbol "MKTW." As of June 30, 2026, the Company had 2,666,908 Class A common shares and 12,986,774 Class B common shares issued and outstanding, totaling 15,653,682 Class A and Class B common shares.
When determining the market capitalization or equity value of the Company, we believe it is appropriate to include the total of the Class A and Class B common shares. Net Income attributable to noncontrolling interests on Condensed Consolidated Statements of Operations is primarily associated with these Class B shares and is a result of our corporate structure.
FY 2026 Targets
Our strategic plans and initiatives are built around bringing high-quality investing ideas and tools to our customers at a dynamic and volatile time for markets. Our focus will continue to be on delivering high-quality products to our customers, in an efficient manner, which we believe will drive both top line growth and margin expansion. Further, we intend to continue our disciplined approach to capital allocation with a mix of dividends, share repurchases, and prudent investments in our business.
For FY 2026, our targets are as follows:
- Billings of approximately $330 million for FY 2026, which is growth of approximately 21.7% from FY 2025 Billings.
- CFFO of approximately $50 million for FY 2026 which is nearly a 10% YoY increase as compared to FY 2025.
- Total dividends of $1.80 per share of MarketWise, Inc. Class A common stock.
These forward-looking targets are based on trends and market conditions as they exist currently, and actual results may differ materially. In the case of dividends, amounts are subject to the ongoing approval by our Board of Directors.
About MarketWise
Founded with a mission to level the playing field for self-directed investors, today MarketWise is a leading multi-brand subscription services platform providing premium financial research, software, education, and tools for investors.
With more than 25 years of operating history, MarketWise serves a community of millions of free and paid subscribers. MarketWise’s products are a trusted source for high-value financial research, education, actionable investment ideas, and investment software. MarketWise is a 100% digital, direct-to-customer company offering its research across a variety of platforms including mobile, desktops, and tablets. MarketWise has a proven, agile, and scalable platform and our vision is to become the leading financial solutions platform for self-directed investors.
Key Business Metrics and Non-GAAP Financial Measures
In this release we discuss certain key business metrics, which we believe provide useful information about the Company’s business and the operational factors underlying the Company’s financial performance. We are not aware of any uniform standards for calculating these key metrics, which may hinder comparability with other companies who may calculate similarly titled metrics in a different way.
Billings is defined as amounts invoiced to customers.
Paid Subscribers is defined as the total number of unique subscribers with at least one paid subscription at the end of the period.
Active Free Subscribers are unique subscribers who have subscribed to one of our free investment publications via a valid email address and who have received and/or consumed our content during the quarter, excluding any Paid Subscribers who also have free subscriptions.
Average revenue per user or ARPU is defined as the trailing four quarters of net Billings divided by the average number of quarterly total Paid Subscribers over that period.
In addition to our results determined in accordance with GAAP, we believe that the below non-GAAP financial measures are useful in evaluating operating performance. We use the below non-GAAP financial measures, collectively, to evaluate our ongoing operations and for internal planning and forecasting purposes. We believe that non-GAAP financial information, when taken collectively, may be helpful to investors because it provides consistency and comparability with past financial performance. This non-GAAP financial information is presented for supplemental informational purposes only and should not be considered a substitute for financial information presented in accordance with GAAP, and may be different from similarly titled non-GAAP measures used by other companies. A reconciliation is provided below for each non-GAAP financial measure to the most directly comparable financial measure stated in accordance with GAAP. Investors are encouraged to review the related GAAP financial measures and the reconciliations of these non-GAAP financial measures to their most directly comparable GAAP financial measures.
Management uses these non-GAAP measures internally to evaluate performance and make operating decisions, and we believe they provide a meaningful perspective to investors when used in conjunction with our GAAP results.
These non-GAAP measures have limitations as analytical tools, and should not be considered in isolation or as substitutes for analysis of other GAAP financial measures, such as cash flow from operations, operating cash flow margin, and net income. Some of the limitations of using these non-GAAP measures are that these metrics may be calculated differently by other companies in our industry.
Adjusted CFFO is defined as cash flow from operations (“CFFO”) plus or minus any non-recurring items.
Adjusted CFFO Margin is defined as Adjusted CFFO as a percentage of Billings.
We believe that Adjusted CFFO and Adjusted CFFO Margin are useful indicators that provide information to management and investors about our ability to generate cash, and for internal planning and forecasting purposes.
We expect Adjusted CFFO and Adjusted CFFO Margin to fluctuate in future periods as we invest in our business to execute our growth strategy. These activities, along with any non-recurring items as described above, may result in fluctuations in Adjusted CFFO and Adjusted CFFO Margin in future periods.
Free Cash Flow is defined as net cash provided by (used in) operating activities less capital expenditures. We define capital expenditures as purchases of property and equipment plus capitalized software development costs. Acquisitions are not included in capital expenditures.
We believe Free Cash Flow is a useful indicator that provides information to management and investors about the cash generated by the business that is available for discretionary purposes, such as dividends and strategic investments.
Non-GAAP Measures
The following table provides a reconciliation of net cash provided by (used in) operating activities to Adjusted CFFO, and net cash provided by operating activities margin as a percentage of total net revenue to Adjusted CFFO Margin, net cash provided by (used in) operating activities to Free Cash Flow, in each case, the most directly comparable financial measure calculated in accordance with generally accepted accounting principles in the United States (“GAAP”):
| (In thousands) | Three Months Ended June 30, | Six Months Ended June 30, | ||||||||||||||||||||
| 2026 | 2025 | % Change | 2026 | 2025 | % Change | |||||||||||||||||
| Net cash provided by (used in) operating activities | $ | 22,421 | $ | 17,842 | 25.7 | % | $ | 20,346 | $ | 19,575 | 3.9 | % | ||||||||||
| Total net revenue | 75,808 | 79,950 | (5.2 | )% | 152,837 | 163,457 | (6.5 | )% | ||||||||||||||
| Net cash provided by (used in) operating activities margin | 29.6 | % | 22.3 | % | 13.3 | % | 12.0 | % | ||||||||||||||
| Adjusted CFFO | $ | 22,421 | $ | 17,842 | 25.7 | % | $ | 20,346 | $ | 19,575 | 3.9 | % | ||||||||||
| Billings | 91,160 | 58,192 | 56.7 | % | 172,533 | 128,648 | 34.1 | % | ||||||||||||||
| Adjusted CFFO margin | 24.6 | % | 30.7 | % | 11.8 | % | 15.2 | % | ||||||||||||||
| Net cash provided by (used in) operating activities | $ | 22,421 | $ | 17,842 | 25.7 | % | $ | 20,346 | $ | 19,575 | 3.9 | % | ||||||||||
| Capital expenditures | (1,019 | ) | (339 | ) | 200.6 | % | (1,619 | ) | (561 | ) | 188.6 | % | ||||||||||
| Free Cash Flow | $ | 21,402 | $ | 17,503 | $ | 18,727 | $ | 19,014 | ||||||||||||||
Cautionary Statement Regarding Forward-Looking Statements
This press release contains forward-looking statements within the meaning of the Private Securities Litigation Reform Act of 1995, including statements regarding the financial position, business strategy, and the plans and objectives of management for future operations of MarketWise. These forward-looking statements generally are identified by the words “believe,” “project,” “expect,” “anticipate,” “estimate,” “intend,” “strategy,” “future,” “opportunity,” “plan,” “may,” “should,” “will,” “would,” “will be,” “will continue,” “will likely result,” “target,” and similar expressions, but the absence of these words does not mean that a statement is not forward-looking. Forward-looking statements are predictions, projections, and other statements about future events that are based on current expectations and assumptions and, as a result, are subject to risks and uncertainties. Many factors could cause actual future events to differ materially from the forward-looking statements in this press release, including, but not limited to: our ability to attract new subscribers and to persuade existing subscribers to renew their subscription agreements with us and to purchase additional products and services from us; our ability to adequately market our products and services, and to develop additional products and product offerings; our ability to manage our growth effectively, including through acquisitions; failure to maintain and protect our reputation for trustworthiness and independence; our ability to attract, develop, and retain capable management, editors, and other key personnel; our ability to grow market share in our existing markets or any new markets we may enter; adverse or weakened conditions in the financial sector, global financial markets, and global economy; current macroeconomic events, including heightened inflation, rise in interest rates and the potential for an economic recession; failure to comply with laws and regulations or other regulatory action or investigations, including the Investment Advisers Act of 1940, as amended; our ability to respond to and adapt to changes in technology and consumer behavior; failure to successfully identify and integrate acquisitions, or dispose of assets and businesses; our public securities’ potential liquidity and trading; the impact of the regulatory environment and complexities with compliance related to such environment; our future capital needs; our ability to maintain an effective system of internal control over financial reporting, and to address and remediate existing material weaknesses in our internal control over financial reporting; and other factors beyond our control.
The foregoing list of factors is not exhaustive. You should carefully consider the foregoing factors and the other risks and uncertainties described in the “Risk Factors” section of our filings with the U.S. Securities and Exchange Commission (the “SEC”). These filings identify and address other important risks and uncertainties that could cause actual events and results to differ materially from those contained in the forward-looking statements. New risks emerge from time to time. It is not possible for our management to predict all risks, nor can we assess the impact of all factors on our business or the extent to which any factor, or combination of factors, may cause actual results to differ materially from those contained in any forward-looking statements we may make. In light of these risks, uncertainties and assumptions, the forward-looking events and circumstances discussed in this press release may not occur and actual results could differ materially and adversely from those anticipated.
Forward-looking statements speak only as of the date they are made. Readers are cautioned not to put undue reliance on forward-looking statements, and we assume no obligation and do not intend to update or revise these forward-looking statements, whether as a result of new information, future events or otherwise. We do not give any assurance that we will achieve our expectations.
Table 1. Income Statement
| (Unaudited, in thousands, except per share data) | Three Months Ended June 30, | Six Months Ended June 30, | |||||||||||||
| 2026 | 2025 | 2026 | 2025 | ||||||||||||
| Net revenue | $ | 75,290 | $ | 79,309 | $ | 151,667 | $ | 162,323 | |||||||
| Related party revenue | 518 | 641 | 1,170 | 1,134 | |||||||||||
| Total net revenue | 75,808 | 79,950 | 152,837 | 163,457 | |||||||||||
| Operating expenses: | |||||||||||||||
| Cost of revenue(1) | 11,112 | 10,950 | 22,259 | 22,885 | |||||||||||
| Sales and marketing(1) | 42,815 | 31,626 | 82,510 | 65,704 | |||||||||||
| General and administrative(1) | 22,693 | 19,744 | 46,860 | 37,072 | |||||||||||
| Research and development(1) | 2,721 | 2,141 | 5,046 | 4,487 | |||||||||||
| Depreciation and amortization | 565 | 500 | 1,083 | 1,031 | |||||||||||
| Impairment of intangible assets | — | — | — | 380 | |||||||||||
| Related party expense | 158 | 178 | 431 | 307 | |||||||||||
| Total operating expenses | 80,064 | 65,139 | 158,189 | 131,866 | |||||||||||
| (Loss) income from operations | (4,256 | ) | 14,811 | (5,352 | ) | 31,591 | |||||||||
| Other income, net | 1,182 | 343 | 1,276 | 501 | |||||||||||
| Interest income, net | 290 | 769 | 800 | 1,710 | |||||||||||
| (Loss) income before income taxes | (2,784 | ) | 15,923 | (3,276 | ) | 33,802 | |||||||||
| Income tax expense | (156 | ) | 613 | (94 | ) | 1,651 | |||||||||
| Net (loss) income | (2,628 | ) | 15,310 | (3,182 | ) | 32,151 | |||||||||
| Net (loss) income attributable to noncontrolling interests | (1,999 | ) | 14,013 | (1,980 | ) | 29,964 | |||||||||
| Net (loss) income attributable to MarketWise, Inc. | $ | (629 | ) | $ | 1,297 | $ | (1,202 | ) | $ | 2,187 | |||||
| Earnings per share – basic | $ | (0.24 | ) | $ | 0.55 | $ | (0.47 | ) | $ | 0.99 | |||||
| Earnings per share – diluted | $ | (0.24 | ) | $ | 0.53 | $ | (0.47 | ) | $ | 0.95 | |||||
| Weighted average shares outstanding – basic | $ | 2,643 | $ | 2,357 | $ | 2,554 | $ | 2,205 | |||||||
| Weighted average shares outstanding – diluted | $ | 2,643 | $ | 2,445 | $ | 2,554 | $ | 2,302 | |||||||
(1) Cost of revenue, sales and marketing, general and administrative, and research and development expenses are exclusive of depreciation and amortization shown as a separate line item
Table 2. Balance Sheet
| (in thousands, except share and per share data) | June 30, 2026 (unaudited) | December 31, 2025 | |||||
| Assets | |||||||
| Current assets: | |||||||
| Cash and cash equivalents | $ | 32,914 | $ | 70,140 | |||
| Accounts receivable | 3,128 | 5,722 | |||||
| Prepaid expenses | 7,679 | 10,799 | |||||
| Related party receivables | 635 | 838 | |||||
| Deferred contract acquisition costs, current | 41,950 | 43,388 | |||||
| Other current assets | 899 | 814 | |||||
| Total current assets | 87,205 | 131,701 | |||||
| Property and equipment, net | 416 | 453 | |||||
| Operating lease right-of-use assets | 6,100 | 6,684 | |||||
| Intangible assets, net | 3,799 | 3,813 | |||||
| Goodwill | 30,043 | 30,043 | |||||
| Deferred contract acquisition costs, noncurrent | 47,012 | 34,678 | |||||
| Deferred tax assets | 11,300 | 11,007 | |||||
| Total assets | $ | 185,875 | $ | 218,379 | |||
| Liabilities and stockholders’ deficit | |||||||
| Current liabilities: | |||||||
| Trade and other payables | $ | 7,023 | $ | 3,868 | |||
| Related party payables | 1,877 | 509 | |||||
| Accrued expenses | 31,535 | 33,221 | |||||
| Deferred revenue and other contract liabilities | 191,758 | 183,798 | |||||
| Operating lease liabilities, current | 743 | 908 | |||||
| Related party TRA liability, current (Note 10) | 577 | — | |||||
| Other current liabilities | 14,152 | 11,900 | |||||
| Total current liabilities | 247,665 | 234,204 | |||||
| Deferred revenue and other contract liabilities, noncurrent | 195,043 | 185,754 | |||||
| Related party TRA liability, noncurrent (Note 10) | 2,511 | 4,260 | |||||
| Other liabilities, noncurrent | 3,133 | 2,611 | |||||
| Operating lease liabilities, noncurrent | 4,793 | 5,175 | |||||
| Total liabilities | 453,145 | 432,004 | |||||
| Stockholders’ deficit: | |||||||
| Common stock - Class A, par value of $0.0001 per share, 47,500,000 shares authorized; 2,666,908 and 2,445,010 shares issued and outstanding at June 30, 2026 and December 31, 2025, respectively | — | — | |||||
| Common stock - Class B, par value of $0.0001 per share, 15,000,000 shares authorized; 12,986,774 and 13,612,641 shares issued and outstanding at June 30, 2026 and December 31, 2025, respectively | 1 | 1 | |||||
| Preferred stock - par value of $0.0001 per share, 100,000,000 shares authorized; 0 shares issued and outstanding at June 30, 2026 and December 31, 2025, respectively | — | — | |||||
| Additional paid-in capital | 81,395 | 101,945 | |||||
| Accumulated other comprehensive income | 20 | 36 | |||||
| Accumulated deficit | (114,866 | ) | (113,664 | ) | |||
| Total stockholders’ deficit attributable to MarketWise, Inc. | (33,450 | ) | (11,682 | ) | |||
| Noncontrolling interest | (233,820 | ) | (201,943 | ) | |||
| Total stockholders’ deficit | (267,270 | ) | (213,625 | ) | |||
| Total liabilities and stockholders’ deficit | $ | 185,875 | $ | 218,379 | |||
Table 3. Cash Flows
| (Unaudited, in thousands) | Six Months Ended June 30, | |||||||
| 2026 | 2025 | |||||||
| Operating activities: | ||||||||
| Net (loss) income | $ | (3,182 | ) | $ | 32,151 | |||
| Adjustments to reconcile net (loss) income to net cash provided by operating activities: | ||||||||
| Depreciation and amortization | 1,083 | 1,031 | ||||||
| Impairment of property and equipment, net | — | 380 | ||||||
| Stock-based compensation | 5,122 | 5,698 | ||||||
| Change in fair value of contingent consideration | (60 | ) | (1,441 | ) | ||||
| Loss on disposal of property and equipment | 586 | — | ||||||
| Deferred taxes | 22 | 1,651 | ||||||
| Unrealized gains on foreign currency | (14 | ) | — | |||||
| Other gains | (1,092 | ) | (1,908 | ) | ||||
| Noncash lease expense | 588 | 2,545 | ||||||
| Changes in operating assets and liabilities: | ||||||||
| Accounts receivable | 2,726 | (2,192 | ) | |||||
| Related party receivables and payables | 1,631 | 1,308 | ||||||
| Prepaid expenses | 3,119 | 2,764 | ||||||
| Other current assets and other assets | (85 | ) | 419 | |||||
| Deferred contract acquisition costs | (11,728 | ) | 16,645 | |||||
| Trade and other payables | 3,169 | (1,374 | ) | |||||
| Accrued expenses | (1,686 | ) | (184 | ) | ||||
| Deferred revenue | 18,934 | (33,107 | ) | |||||
| Operating lease liabilities | (551 | ) | (2,937 | ) | ||||
| Other current and long-term liabilities | 1,764 | (1,874 | ) | |||||
| Net cash provided by operating activities | 20,346 | 19,575 | ||||||
| Investing activities: | ||||||||
| Purchases of property and equipment | (627 | ) | (163 | ) | ||||
| Capitalized software development costs | (992 | ) | (398 | ) | ||||
| Net cash used in investing activities | (1,619 | ) | (561 | ) | ||||
| Financing activities: | ||||||||
| Proceeds from issuance of common stock | 143 | 283 | ||||||
| Repurchases of stock | (370 | ) | (1,851 | ) | ||||
| Restricted stock units withheld to pay taxes | (859 | ) | (583 | ) | ||||
| Dividends paid to Class A shareholders | (2,329 | ) | (2,758 | ) | ||||
| Repurchase of stock and reduction in related TRA liability as part of legal settlement | (12,160 | ) | — | |||||
| Tax distributions to noncontrolling interests | (33,711 | ) | (33,759 | ) | ||||
| Other distributions to noncontrolling interests | (6,651 | ) | (9,110 | ) | ||||
| Net cash used in financing activities | (55,937 | ) | (47,778 | ) | ||||
| Effect of exchange rate changes on cash | (16 | ) | — | |||||
| Net decrease in cash and cash equivalents | (37,226 | ) | (28,764 | ) | ||||
| Cash and cash equivalents — beginning of period | 70,140 | 97,876 | ||||||
| Cash and cash equivalents — end of period | $ | 32,914 | $ | 69,112 | ||||
MarketWise Investor Relations Contact
Erik Mickels – Chief Operating and Financial Officer
Email: ir@marketwise.com
MarketWise Media Contact
Email: media@marketwise.com
Figures accompanying this announcement are available at:
https://www.globenewswire.com/NewsRoom/AttachmentNg/2ecebb99-587c-4efb-8761-c663e978cd12
https://www.globenewswire.com/NewsRoom/AttachmentNg/c16c49b4-052a-4f24-ab71-a50268cae0fc
https://www.globenewswire.com/NewsRoom/AttachmentNg/7fe6a4eb-04c6-40bb-af4c-ea974a568eb5
https://www.globenewswire.com/NewsRoom/AttachmentNg/b540c790-2e7c-4327-8148-1fded30bd3a9
https://www.globenewswire.com/NewsRoom/AttachmentNg/47916752-61e3-4526-b0e1-4e43f3bc9877
